160 Year History of Government Spring
160 Year History of Government Spring |
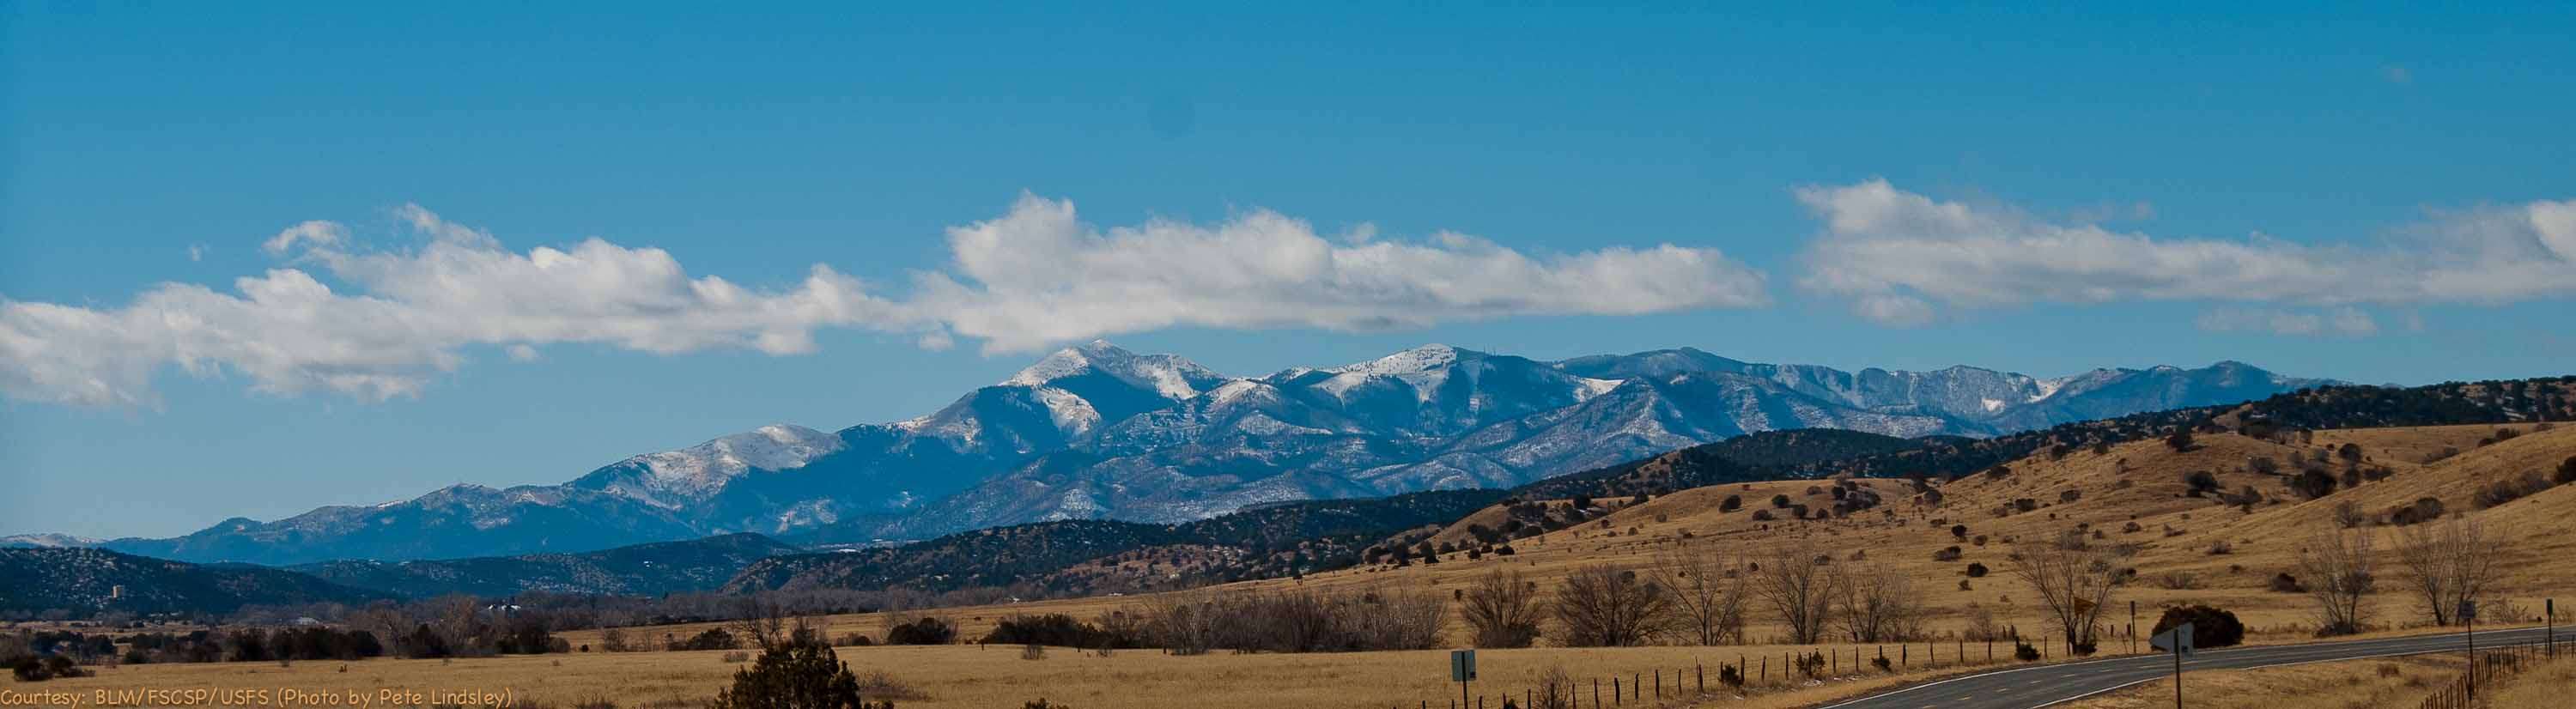
Ruidoso and Sierra Blanca peak lie to the south of Highway 380, near Government Spring |
||||
 |
||||
Water from Sierra Blanca flows north down several intermittent streams, including the underground Snowy River |
||||
 |
||||
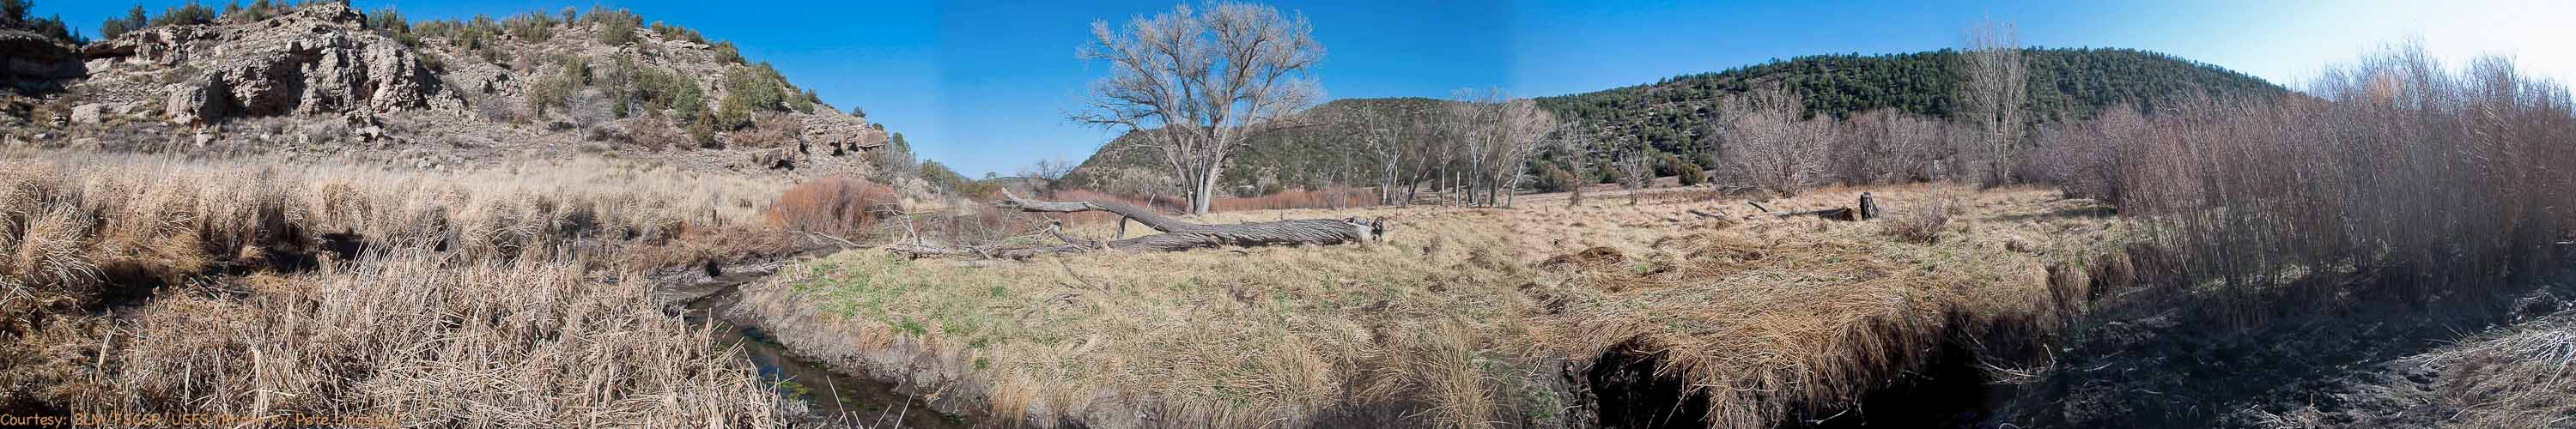
Just north of Highway 380 is a large riparian area that includes Government Spring
|
||||
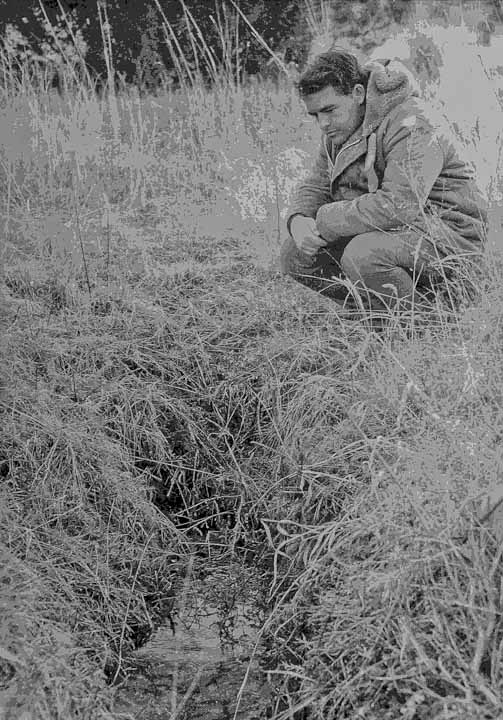
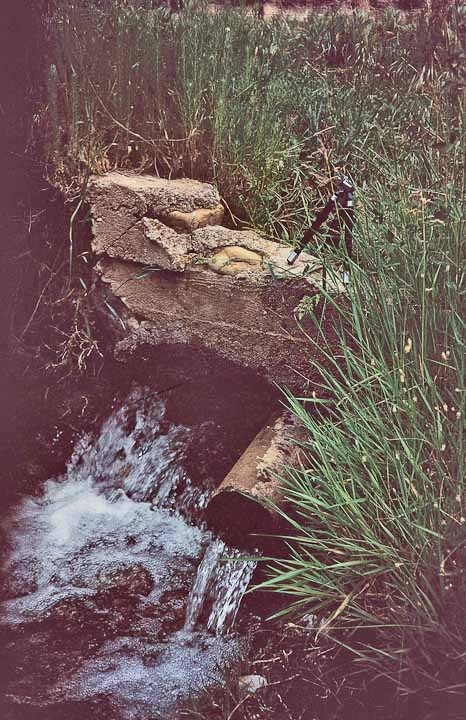
This 1963 photo shows Government Spring before the willows grew up around this important resurgence into the Rio Bonito surface stream. Cavers guessed that the water came from the nearby Fort Stanton Cave, but it would be 4 decades later before Snowy River was discovered and was found to end on the north end of world record 11-mile long calcite formation that went under the Ruidoso Airport. |
 |
Another photo from the 1960s shows an improvised concrete dam that dropped the spring flow down into the Rio Bonito which runs under Highway 380 towards Capitan, NM. We know that Native Americans used the spring before Fort Stanton was built in the mid 1800s, and the troops stationed at the historic fort visited the spring as well as the cave, leaving their signatures on "Signature Wall". |
 |
|
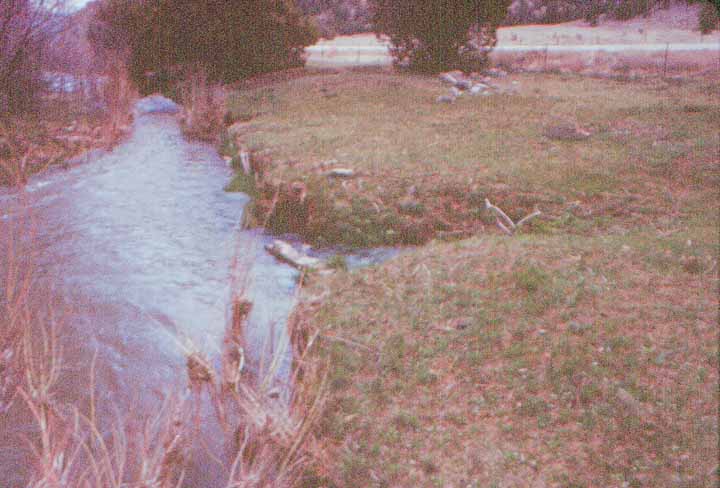
The Rio Bonito in the 1960s, showing the highway between Capitan and Lincoln, NM, and also Government Spring. The spring was even noted on some of the first maps in the 1800s, shortly after the Fort was established. |
 |
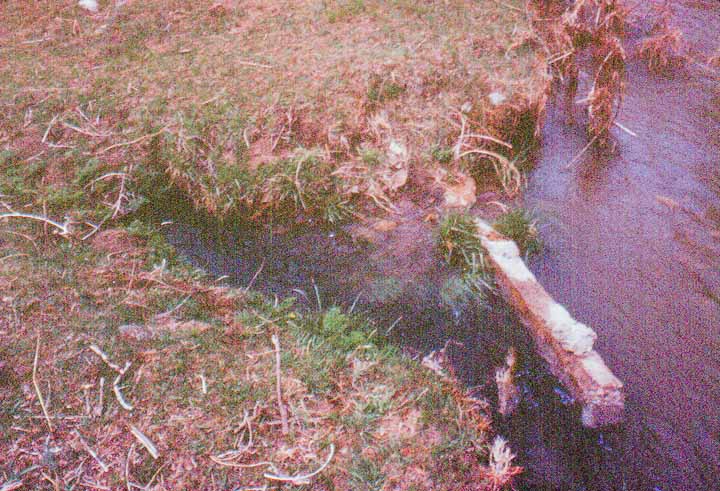
Buzz Hummel, the BLM Fort Stanton Cave Specialist at the time, took these photos showing the dam structure on the spring, now long gone. |
 |
|
| The USGS placed a water monitoring unit on the Rio Bonito just downstream from the spring and was in operation from 1999-2002. | 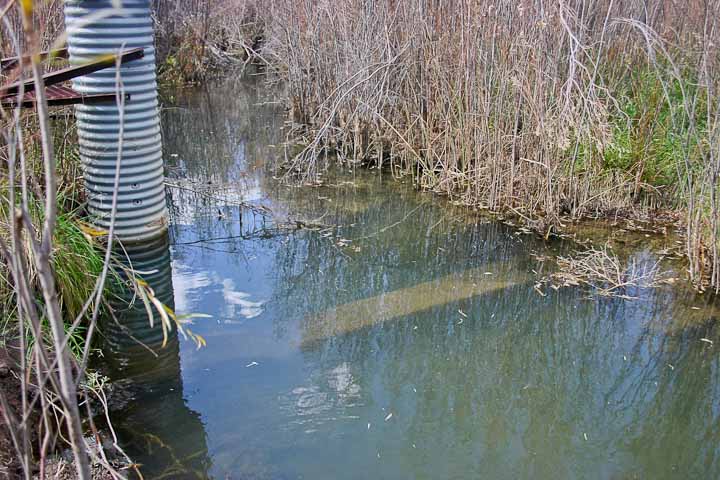 |
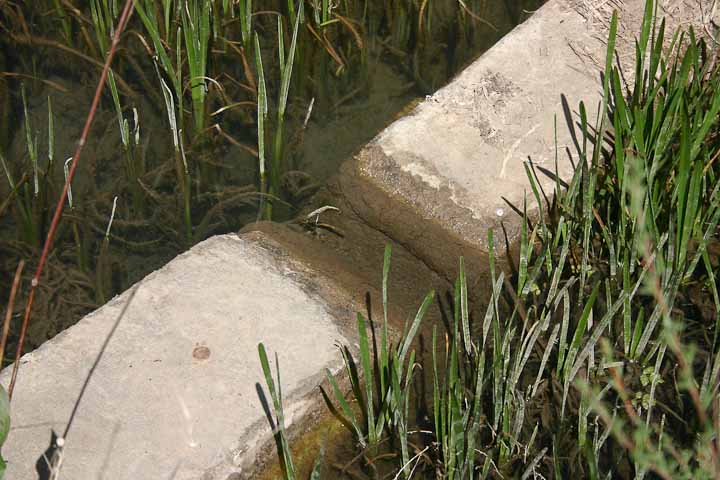
This concrete "weir" allowed calibration of the USGS station, no longer "on line" due to lack of funding. |
 |
|
| It is critical that Government Spring, first used by the Native Americans and later in the 19th century by the residents of Fort Stanton, is kept in good repair. | 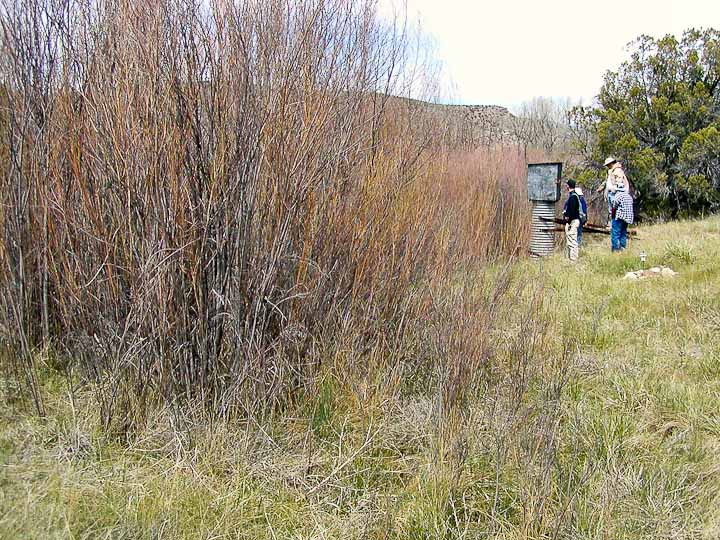 |
Normally in areas like this there would be a 100-foot buffer zone around all springs to exclude mechanized equipment. Other nearby riparian areas would also be protected. |
 |
|
| Members of the Hydrogeology Working Group discuss the high Rio Bonito flows after the Little Bear Fire. The initial flood in 2016 covered Government Spring with 14 inches of hard packed, black mud. Spring flow was regained after careful removal of the mud during a dry period | 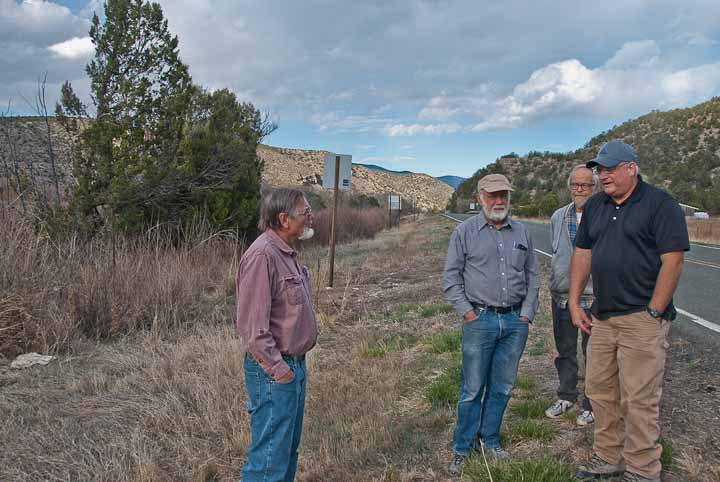 |
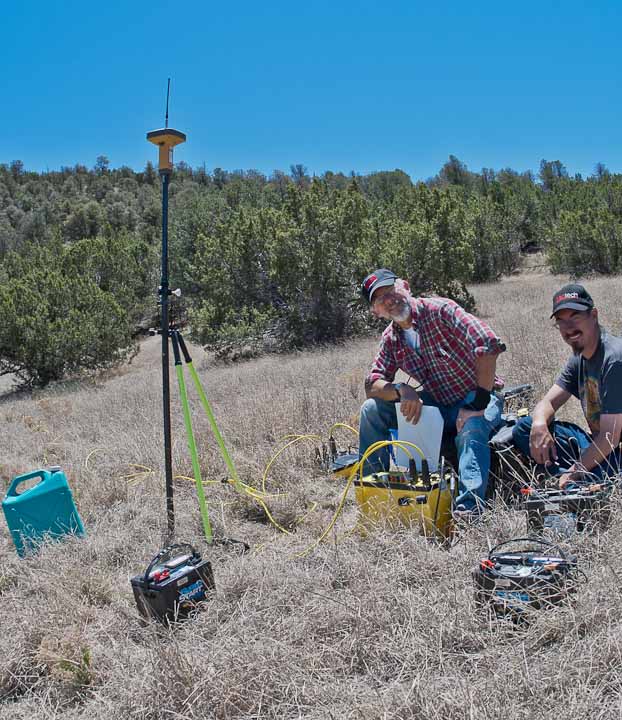
Hydrogeologists running a resistivity line across the underground water conduit running from Crystal Lake in Fort Stanton Cave to Government Spring, just on the other side of Highway 380. |
 |
|
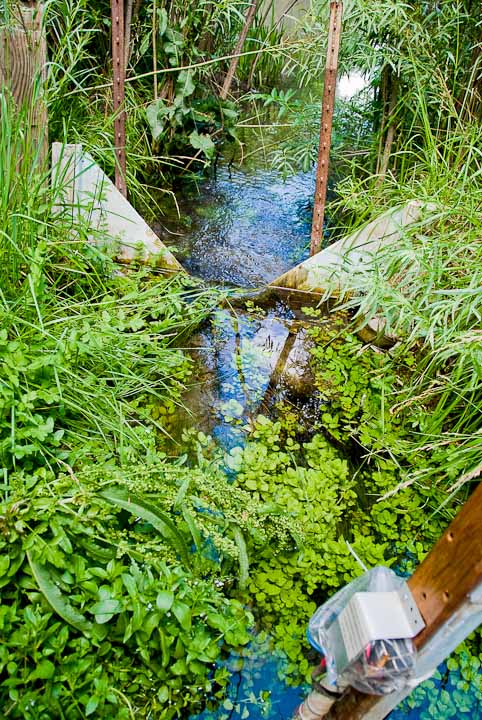
| This riparian area on the north side of the highway is formed along the Rio Bonito after it crosses under the highway near the cutoff to Fort Stanton | 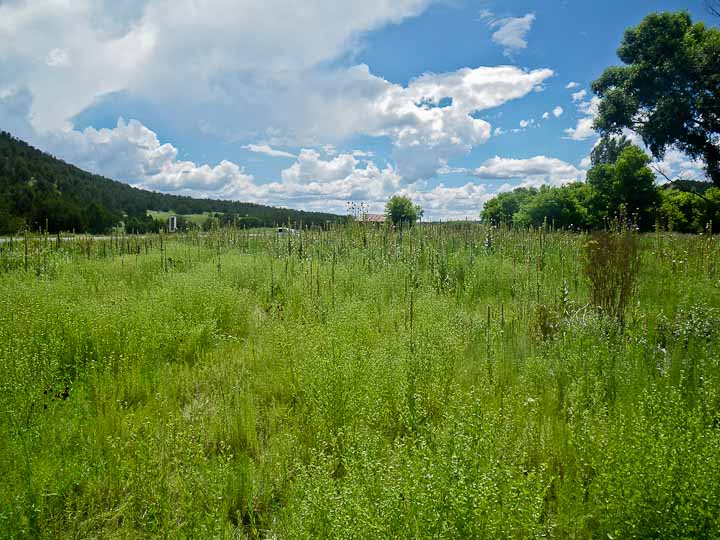 |
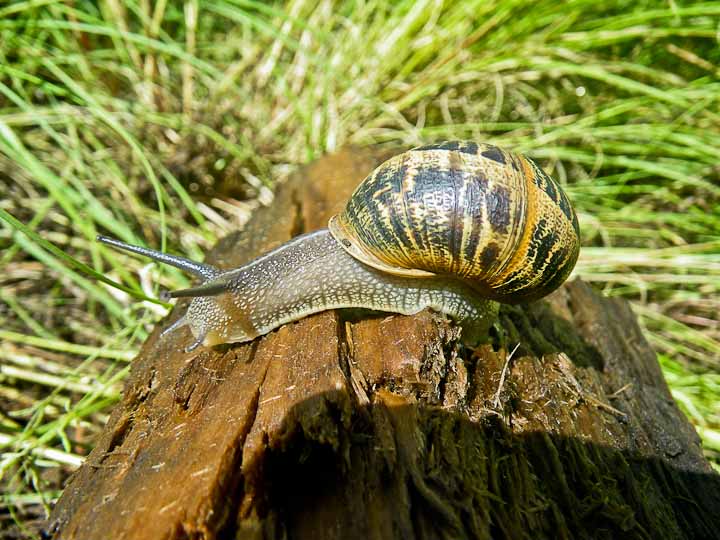
Deer and elk are sometimes seen along with smaller critters like this colorful snail |
 |
|
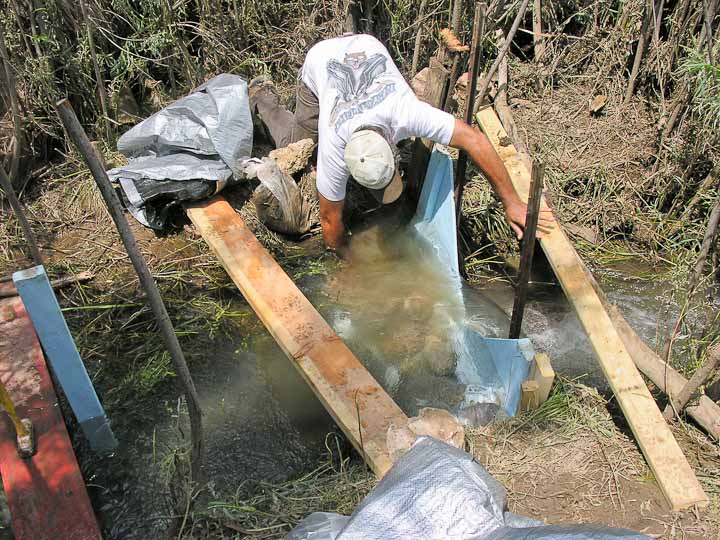
| In August, 2008, a plywood V-notch weir was fabricated to monitor the Government Spring flow. It would last almost 4 years until July 9, 2012, when a flooding Rio Bonito washed out the structure. | 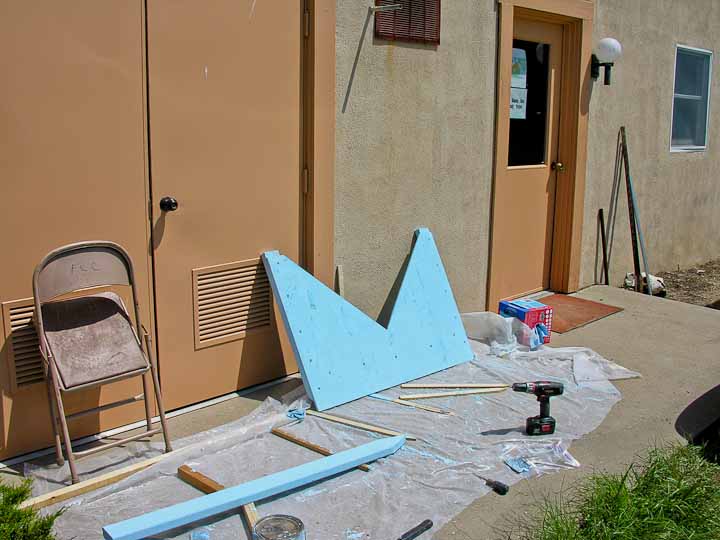 |
Care was taken to seal the water leaks on the side and bottom of the weir so that data on the relative flows could be correlated with data loggers installed in the cave on Snowy River. More information is available HERE. |
 |
|
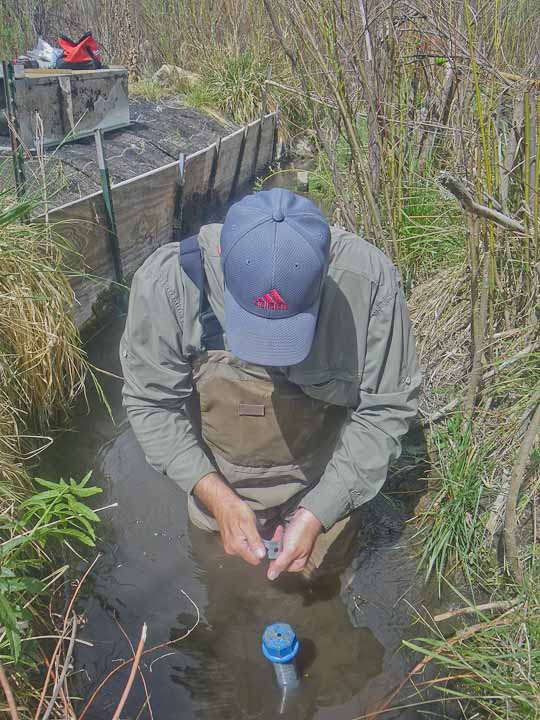
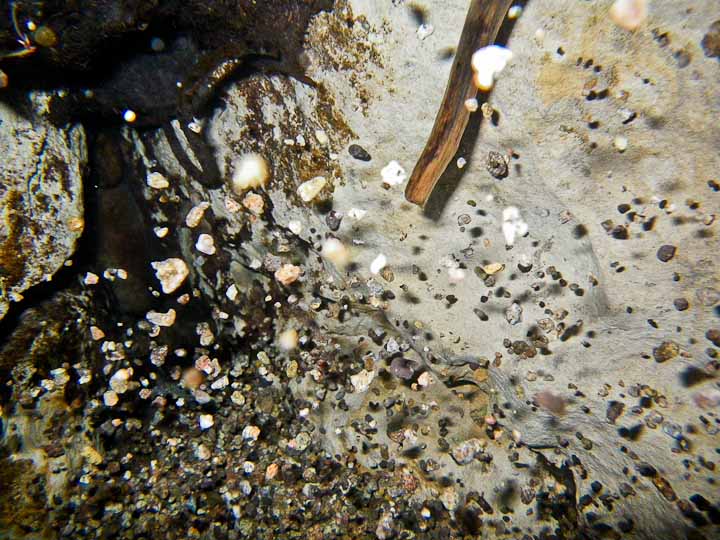
 . . 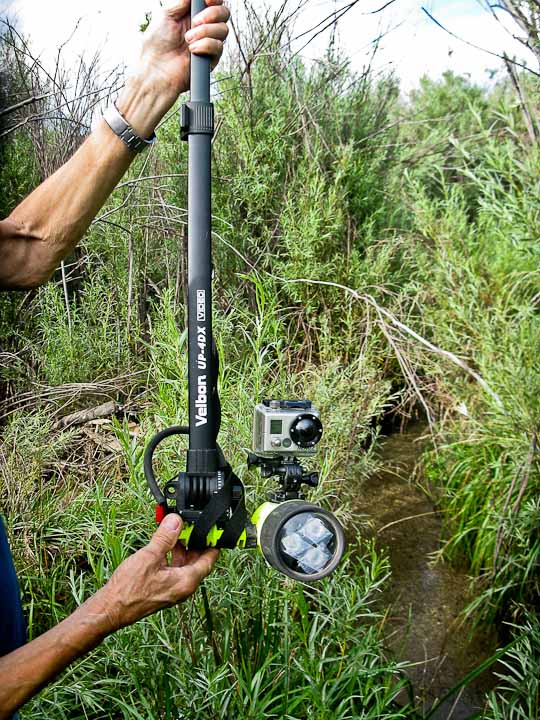 . . 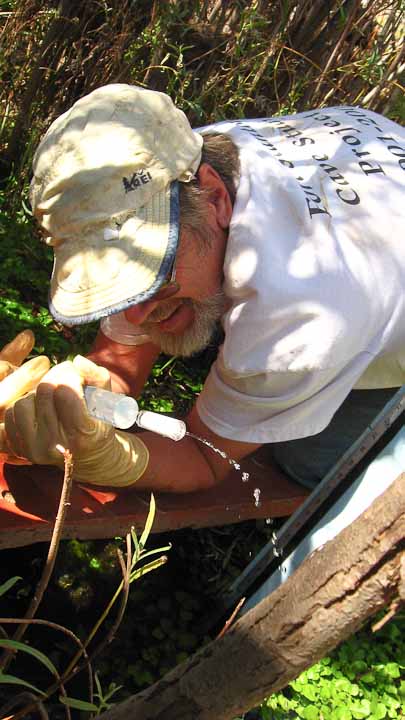 When the spring pool clears up a GoPro camera mounted on a dive light was used to photograph the bottom. The photo on the right shows a DNA sample being collected in a special filter that requires pumping the water through the filter. |
||||
| This shows Crystal Spring which feeds Crystal Lake, the water source in the cave that provides most of the water in Government Spring, 1500 feet away. This water is monitored by water data loggers. | 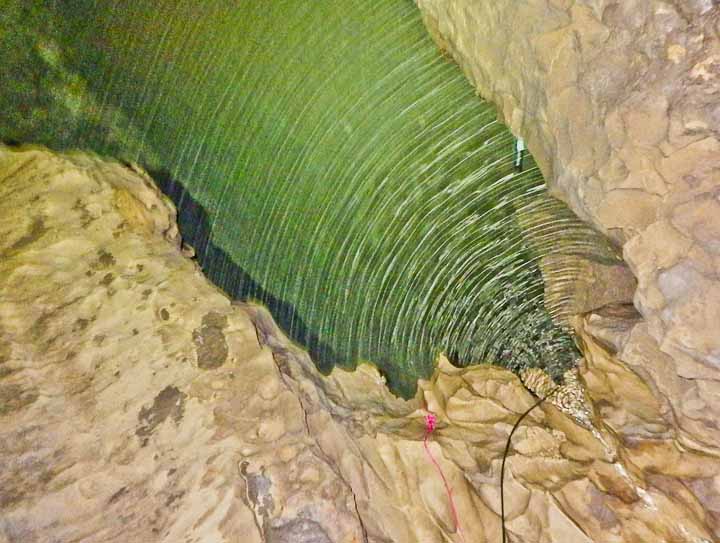 |
The water appears to mostly come up out of several narrow spring vents in the limestone. When Snowy River is running, the water volume forces the small gravel to swirl up into the spring pool. |
 |
|
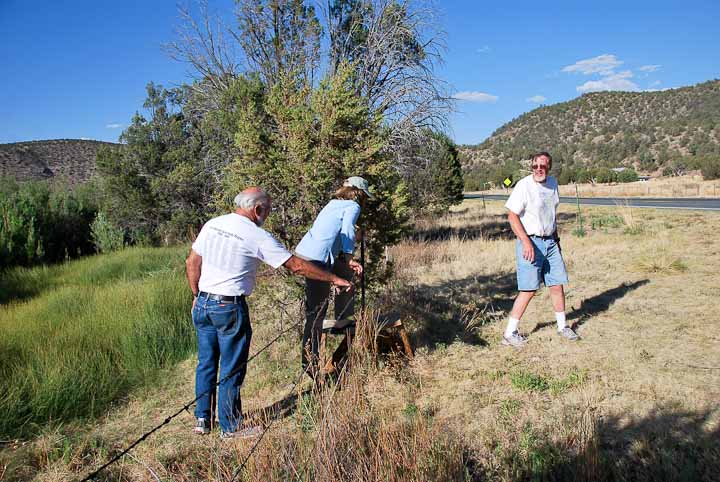
| In August, 2017, the BLM installed a flume in the place of the previously proposed V-notch weir. The flume is a better fit for the spring pool for monitoring the expected spring flows. | 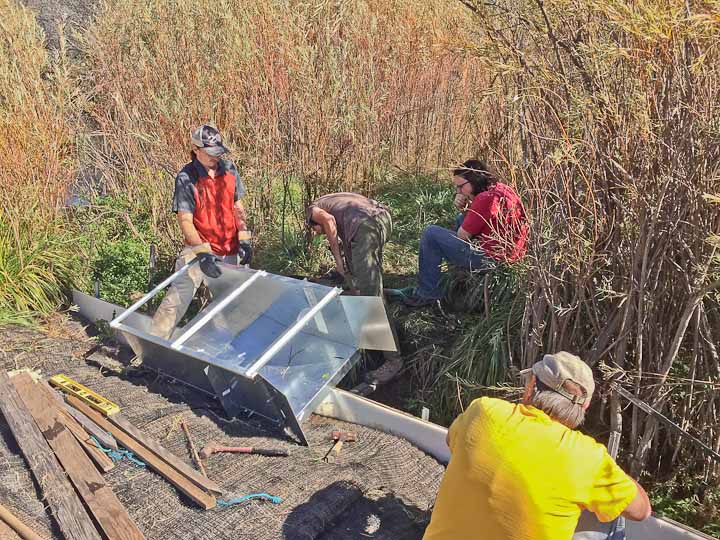 |
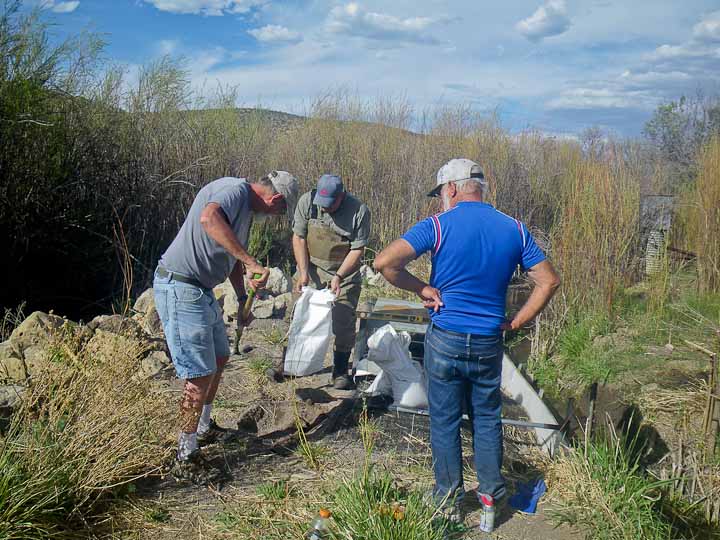
Volunteers are filling special bags with sand and crushed fines as part of the installation. |
 |
|
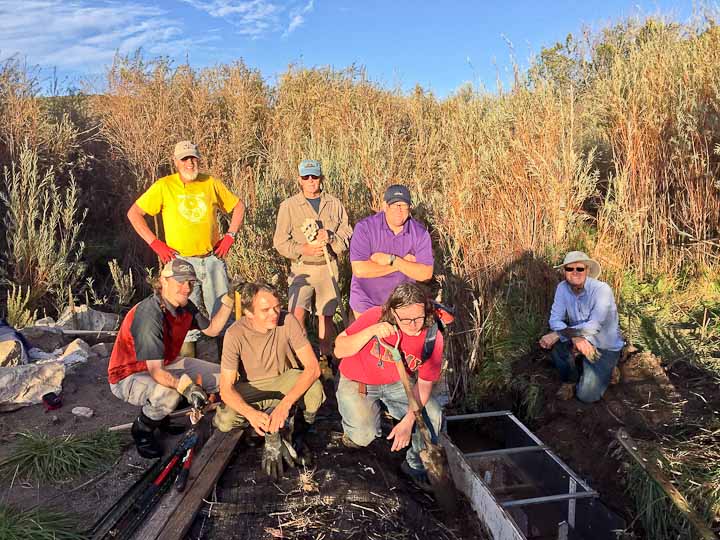
| The flume is designed to be installed level, and the special construction allows real time readings from a scale on the inside. | 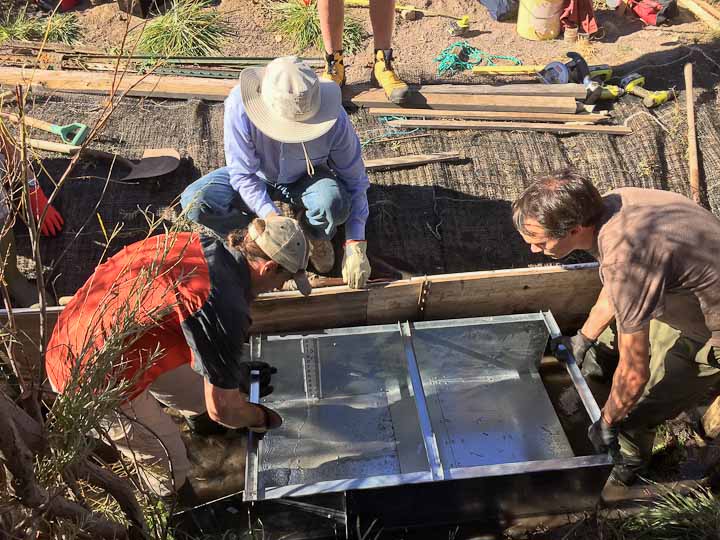 |
The volunteers, under the guidance of BLM hydrologist Michael McGee, finished repositioning the flume. An additional repositioning is planned after future rock work is done. |
 |
|
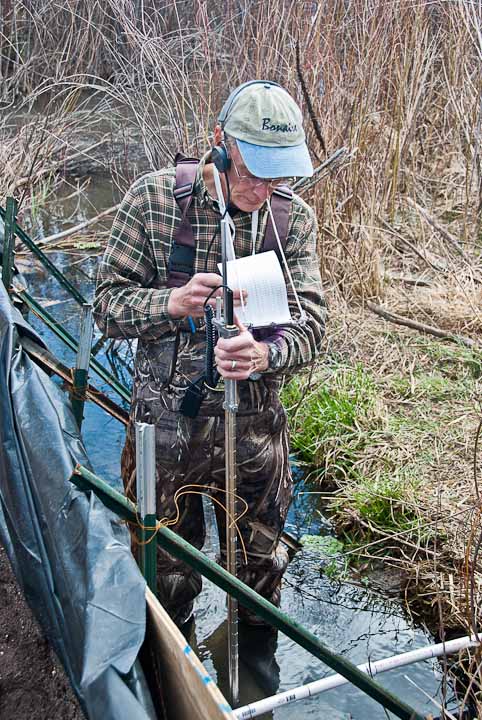
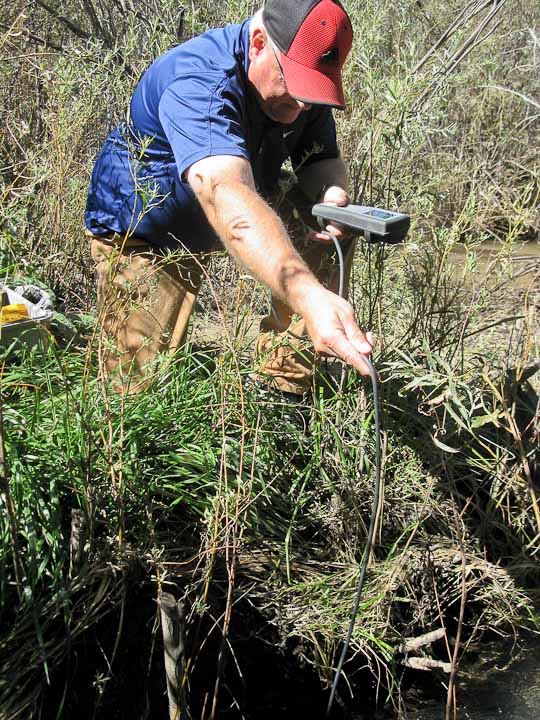
Hydrologists at work in Government Spring use current flow meters and hand-held instruments to characterize the spring flow and water chemistry. Water data loggers are installed deep in the spring vent to measure temperature and depth. |
||||
|
||||
You may be able to set some browsers (Apple Safari for Macs) to enlarge the photos when you "hover" your mouse over each picture. Otherwise, you can click on the photo to get a larger image. |
|
![]()
Rev. 2-19-2019 |
Comments to the webmaster |
Contact the FSCSP President |
Contact the Project Director |
 .
.  .
.